onWatch
CategorySoftware Packages
SubcategoryOther Software
Stars753
Monitor AI API quotas across providers locally with historical tracking, alerts, and a web dashboard to avoid surprise throttling and budget overruns
About onWatch
This large README is shown as a plain-text preview. Read the full README at the source
# onWatch **Free, open-source AI API quota monitoring for developers.** Track usage across [Synthetic](https://synthetic.new), [Z.ai](https://z.ai), [Anthropic](https://anthropic.com), [Codex](https://openai.com/codex), [GitHub Copilot](https://github.com/features/copilot), [MiniMax](https://platform.minimax.io), [Gemini CLI](docs/GEMINI_SETUP.md) (legacy), [Cursor](docs/CURSOR_SETUP.md), [Grok](docs/GROK_SETUP.md), [Kimi Code](docs/KIMI_SETUP.md), and Antigravity in one place. See history, get alerts, and open a local web dashboard before you hit throttling or run over budget. Additionally, you can ingest local telemetry from your own API-driven workflows with API Integrations, keeping track of token use and spending across multiple providers. **Links:** [Website](https://onwatch.onllm.dev) | [Buy Me a Coffee](https://buymeacoffee.com/prakersh) **Trust & Quality** [](https://github.com/onllm-dev/onwatch/stargazers) [](https://github.com/avelino/awesome-go) [](https://github.com/onllm-dev/onwatch/releases) [](https://codecov.io/gh/onllm-dev/onwatch) [](LICENSE) <a href="https://trendshift.io/repositories/22078?utm_source=trendshift-badge&utm_medium=badge&utm_campaign=badge-trendshift-22078" target="_blank" rel="noopener noreferrer"><img src="https://trendshift.io/api/badge/trendshift/repositories/22078/daily?language=Go" alt="onllm-dev%2FonWatch | Trendshift" width="250" height="55"/></a> **Compatibility & Docs** [](https://github.com/onllm-dev/onwatch/releases/tag/v2.14.11) [](https://marketplace.visualstudio.com/items?itemName=onllm-dev.onwatch) [](https://go.dev) [](#quick-start) [](https://pkg.go.dev/github.com/onllm-dev/onwatch/v2) onWatch fills the gap between "current usage snapshot" and the historical, per-cycle, cross-session view that developers actually need. It runs as a lightweight background agent (<50 MB RAM with all providers polling in parallel), stores historical data in SQLite, and serves a Material Design 3 web dashboard with dark/light mode. It works with any tool that uses Synthetic, Z.ai, Anthropic, Codex, GitHub Copilot, MiniMax, Gemini CLI, Cursor, Grok, or Antigravity API keys, including **Cline**, **Roo Code**, **Kilo Code**, **Claude Code**, **Codex CLI**, **Cursor**, **GitHub Copilot**, **MiniMax Coding Plan**, **Grok CLI**, **Antigravity**, and others. **Zero telemetry. Single binary. All data stays on your machine.** **Beta:** onWatch is currently in active development. Features and APIs may change as we refine the product. [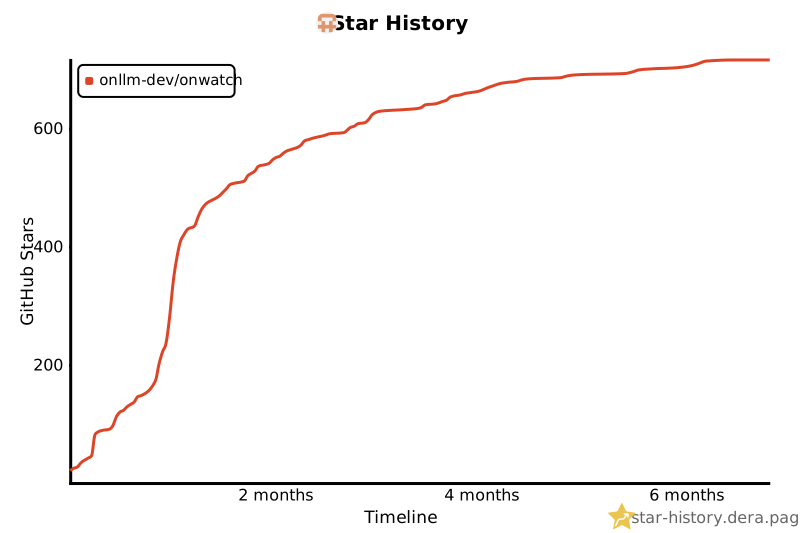](https://star-history.dera.page/#onllm-dev/onwatch&Timeline)  If onWatch helps you track your AI spending, consider giving it a star. It helps others discover the project. > Powered by [onllm.dev](https://onllm.dev) | [Landing Page](https://onwatch.onllm.dev) --- ## Quick Start ### macOS & Linux **One-line install:** ```bash curl -fsSL https://raw.githubusercontent.com/onllm-dev/onwatch/main/install.sh | bash ``` This downloads the binary to `~/.onwatch/`, creates a `.env` config, sets up a systemd service (Linux) or a launchd agent (macOS, offered during install), and adds `onwatch` to your PATH. The installer downloads the standard binary, which includes the menubar companion on macOS and the system tray on Linux desktops. ### Homebrew (macOS & Linux) ```bash brew install onllm-dev/tap/onwatch onwatch setup # Interactive setup wizard for API keys and config ``` ### Windows **One-line install** (PowerShell): ```powershell irm https://raw.githubusercontent.com/onllm-dev/onwatch/main/install.ps1 | iex ``` Or download `install.bat` from the [Releases](https://github.com/onllm-dev/onwatch/releases) page and double-click it. This downloads the binary to `%USERPROFILE%\.onwatch\`, runs interactive setup for API keys, creates a `.env` config, and adds `onwatch` to your PATH. For manual setup or troubleshooting, see the [Windows Setup Guide](docs/WINDOWS_SETUP.md). ### Manual Installation **Download binaries** from the [Releases](https://github.com/onllm-dev/onwatch/releases) page. Binaries are available for macOS (ARM64, AMD64), Linux (AMD64, ARM64), and Windows (AMD64, ARM64). **Or build from source** (requires Go 1.25+): ```bash git clone https://github.com/onllm-dev/onwatch.git && cd onwatch cp .env.example .env # then add your API keys ./app.sh --build && ./onwatch --debug # or: make build && ./onwatch --debug ``` **Or use Docker** (requires Docker or Docker Compose): ```bash cp .env.docker.example .env # add your API keys docker-compose up -d ``` Or via `app.sh`: ```bash ./app.sh --docker --run ``` The Docker image uses a distroless base (~10-12 MB) and runs as non-root. An Alpine variant with shell access is also available (`ghcr.io/onllm-dev/onwatch:alpine`). Data persists via volume mount at `/data`. Logs go to stdout (`docker logs -f onwatch`). See [Docker Deployment](#docker-deployment) for details. ### Configure Edit `~/.onwatch/.env` (or `.env` in the project directory if built from source): ```bash SYNTHETIC_API_KEY=syn_your_key_here # https://synthetic.new/settings/api ZAI_API_KEY=your_zai_key_here # https://www.z.ai/api-keys ANTHROPIC_TOKEN=your_token_here # Auto-detected from Claude Code credentials CODEX_TOKEN=your_token_here # Recommended for Codex-only setups COPILOT_TOKEN=ghp_your_token_here # GitHub PAT with copilot scope (Beta) ONWATCH_ADMIN_USER=admin ONWATCH_ADMIN_PASS=changeme ``` At least one provider key is required. Configure any combination to track them in parallel. Anthropic tokens are auto-detected from Claude Code credentials (macOS Keychain, Linux keyring, or `~/.claude/.credentials.json`). For Codex-only setups, set `CODEX_TOKEN` in `.env`; during runtime onWatch re-reads Codex auth state from `~/.codex/auth.json` (or `CODEX_HOME/auth.json`) and picks up token changes. Copilot tokens require a GitHub Personal Access Token (classic) with the `copilot` scope. Provider setup guides: - [Windows Setup Guide](docs/WINDOWS_SETUP.md) - Detailed Windows installation & manual configuration - [Codex Setup Guide](docs/CODEX_SETUP.md) - [Copilot Setup Guide](docs/COPILOT_SETUP.md) - [MiniMax Setup Guide](docs/MINIMAX_SETUP.md) - [Antigravity Setup Guide](docs/ANTIGRAVITY_SETUP.md) - [Cursor Setup Guide](docs/CURSOR_SETUP.md) - [API Integration Setup Guide](docs/API_INTEGRATIONS_SETUP.md) ### Run ```bash onwatch # start in background (daemonizes, logs to ~/.onwatch/data/.onwatch.log) onwatch --debug # foreground mode, logs to stdout onwatch stop # stop the running instance onwatch status # check if running ``` Open **http://localhost:9211** and log in with your `.env` credentials. --- ### VS Code Extension Put the same quotas in your editor. The extension is published on the VS Code Marketplace: **https://marketplace.visualstudio.com/items?itemName=onllm-dev.onwatch** ```bash code --install-extension onllm-dev.onwatch ``` It is a thin client: it needs the onWatch daemon running (steps above) and finds it automatically. Status bar item, hover tables and an onWatch sidebar with the quick view. Every GitHub release also ships the extension as `onwatch-vscode-<version>.vsix` for editors without Marketplace access. See [docs/VSCODE_EXTENSION.md](docs/VSCODE_EXTENSION.md). ## What onWatch Tracks (That Your Provider Doesn't) ``` ┌──────────────────────────────────────────────────────────────────┐ │ What your provider shows │ What onWatch adds │ ├───────────────────────────────────┼──────────────────────────────┤ │ Current quota usage │ Historical usage trends │ │ │ Reset cycle detection │ │ │ Per-cycle consumption stats │ │ │ Usage rate & projections │ │ │ Per-session tracking │ │ │ Multi-provider unified view │ │ │ Live countdown timers │ └───────────────────────────────────┴──────────────────────────────┘ ``` **Dashboard** -- Material Design 3 with dark/light mode (auto-detects system preference). Provider tabs appear for each configured provider: - **Synthetic** -- Subscription, Search, and Tool Call quota cards - **Z.ai** -- Tokens, Time, and Tool Call quota cards - **Anthropic** -- Dynamic quota cards (5-Hour, 7-Day, 7-Day Sonnet, Monthly, etc.) with utilization percentages, OAuth token auto-refresh, and automatic rate limit bypass via token rotation - **Codex** -- Dynamic quota cards (LLMs, Review Requests) with OAuth auth-state refresh, historical cycle analytics, **multi-account support (Beta)** for tracking multiple ChatGPT accounts, and an **auto quota-starter (Beta, off by default)** that can start an unstarted 5h/weekly window for you (see FAQ) - **GitHub Copilot (Beta)** -- Premium Interactions, Chat, and Completions quota cards with monthly reset tracking - **MiniMax Coding Plan** -- Shared quota pool tracking for M2, M2.1, and M2.5 models with 5-hour rolling window reset cycles and **multi-account support** for tracking multiple MiniMax subscriptions via the dashboard UI - **Gemini CLI (Legacy)** -- Per-model quota tracking for Gemini 2.5/3.x Pro, Flash, and Flash Lite models with 24-hour reset cycles. Kept working for existing setups, but no longer the recommended path: Google's Gemini CLI has been superseded by Antigravity. New installs should use the `agy` source on the **Antigravity** provider instead - **Antigravity** -- Multi-model quota cards (Claude, Gemini, GPT) with grouped quota pools, logging history, and cycle overview. Selectable data **source** -- the desktop **IDE** probe or the **`agy` CLI** (richer weekly + 5-hour buckets), or **both** (default) -- switchable in the dashboard settings; all variants share one Google-account quota - **Cursor** -- Individual, Team, and Enterprise account tracking with auto-detected credentials from Cursor Desktop SQLite or macOS Keychain/Linux keyring, OAuth token auto-refresh, burn rate forecasts, and on-demand spend tracking - **Kimi Code** -- Moonshot Kimi Code CLI OAuth quotas via `GET /coding/v1/usages` (auto-detect `~/.kimi-code/credentials`). Weekly + window limits with reset countdown. See [Kimi Setup](docs/KIMI_SETUP.md). - **Grok** -- xAI Grok Build / SuperGrok credits tracking via local `~/.grok/auth.json` (or `$GROK_HOME`), optional `grok agent stdio` RPC, and grok.com gRPC-web bearer probe (no browser cookie import). Primary "Credits" utilization against plan limit with reset countdown. Informational local session token stats also captured. - **Moonshot** -- Balance-based tracking for the Moonshot (Kimi) open-platform API. Available, Voucher, and Cash balance cards with drop-rate trends. Set `MOONSHOT_API_KEY`. See [Moonshot Setup](docs/MOONSHOT_SETUP.md). - **DeepSeek** -- Balance-based tracking for the DeepSeek platform API. Total, Granted, and Topped-Up balance cards with drop-rate trends. Set `DEEPSEEK_API_KEY`. See [DeepSeek Setup](docs/DEEPSEEK_SETUP.md). - **OpenCode Go** -- Subscription quota cards (5-Hour, Weekly, and Monthly when present) read from the plan's own meters (used and limit in USD) via the OpenCode console API, using a service-account key (`OPENCODE_GO_API_KEY`) or your browser session (`OPENCODE_GO_WORKSPACE_ID` + `OPENCODE_GO_AUTH_COOKIE`), with cycle history and deep insights. Separate from `OPENCODE_ENABLED`, which only feeds ChatGPT credentials into the Codex provider. See [OpenCode Setup](docs/OPENCODE_SETUP.md). - **Mistral** (beta) - Separate included API and Vibe Code allowances plus pay-as-you-go charges, with browser-cookie import or manual authentication. See [Mistral Setup](docs/MISTRAL_SETUP.md). - **Ollama Cloud** (beta) -- Included monthly usage in USD from the ollama.com API with plan-derived caps, per-model request counts, extra-usage spend, cycle history and insights. Set `OLLAMA_API_KEY`. See [Ollama Setup](docs/OLLAMA_SETUP.md). - **Muse** -- Meta Muse coding-plan quota tracking (5-hour prompts + weekly usage) from the same subscription snapshot `muse /usage` shows, via one minimal probe per poll. Opt-in: set `MUSE_ENABLED=true` and onWatch uses the key `muse login` stored (macOS Keychain / login file), or set `META_API_KEY` directly. Tracking stays off until you opt in, because each poll spends a prompt from your own 5h window. See [Muse Setup](docs/MUSE_SETUP.md). - **Command Code** -- Credit balance plus the 5-hour and weekly rate-limit windows from the Command Code API, with billing-period cost, request and token totals. Auto-detected from the `cmd` CLI login (or the pi / OMP auth store); set `COMMAND_CODE_API_KEY` for Docker and headless hosts. Polling reads billing endpoints only, so it spends no credits. See [Command Code Setup](docs/COMMANDCODE_SETUP.md). - **API Integrations** -- Local JSONL ingestion for custom API-driven workflows and automations. Track per-integration token volume, request counts, recent activity, costs, trends, and accumulated usage across separate API keys and providers. - **All** -- Side-by-side view of all configured providers - **Prometheus metrics endpoint (Beta)** -- Exposes `/metrics` for Prometheus/Grafana/Alertmanager integrations, with optional bearer token protection via `ONWATCH_METRICS_TOKEN` - **PWA installable** -- Install onWatch from your browser for a native app experience (Beta) Each quota card shows: usage vs. limit with progress bar, live countdown to reset, status badge (healthy/warning/danger/critical), and consumption rate with projected usage. **Time-series chart** -- Chart.js area chart showing all quotas as % of limit. Time ranges: 1h, 6h, 24h, 7d, 30d. **API Integrations chart** -- Dedicated telemetry view for custom API-driven scripts. Switch between tokens per request, request counts, accumulated token use, and cost where available. **Insights** -- Burn rate forecasting, billing-period averages, usage variance, trend detection, and cross-quota ratio analysis (e.g., "1% weekly ~ 24% of 5-hr sprint"). Provider-specific: tokens-per-call efficiency and per-tool breakdowns for Z.ai. **Cycle Overview** -- Cross-quota correlation table showing all quota values at peak usage points within each billing period. Helps identify which quotas spike together. **Sessions** -- Every agent run creates a session that tracks peak consumption, letting you compare usage across work periods. **Settings** -- Dedicated settings page (`/settings`) with tabs for general preferences, provider controls, notification thresholds, webhook delivery, and SMTP email configuration. **Custom API Integrations setup** -- Use a small wrapper around your own API calls to append normalised JSONL events into `~/.onwatch/api-integrations/`, then open the API Integrations tab to monitor cumulative and recent usage. Full setup instructions live in [docs/API_INTEGRATIONS_SETUP.md](docs/API_INTEGRATIONS_SETUP.md). **Menubar / system tray (macOS, Linux, Windows - Beta)** -- Every desktop build includes a tray companion. macOS shows the selected quota percentages next to a template icon and opens a native popover. Linux and Windows bake the percentage into a status-colored tray icon and open the same quick view in a frameless window. Two preset views: - **Standard** -- Provider cards with circular quota meters and reset metadata - **Detailed** -- Expanded provider cards with sparkline trends and full quota breakdowns Configure it in **Settings > Menubar**. You can enable or disable the companion, pick the default view, change refresh and threshold settings, choose which quotas the icon shows, and drag providers into the order you want. Platform notes for Linux and Windows live in [docs/TRAY_LINUX_WINDOWS.md](docs/TRAY_LINUX_WINDOWS.md); GNOME users can also use the [GNOME Shell extension](docs/GNOME_MENUBAR_EXTENSION.md). The tray is currently in beta. Feedback is highly appreciated at [github.com/onllm-dev/onwatch/issues](https://github.com/onllm-dev/onwatch/issues). **VS Code extension** -- Shows your tightest quota in the VS Code status bar (`82%`, with time to reset at critical), colored by your theme at warning and critical. Hover for a per-provider breakdown; click to open the quick view or the full dashboard inside VS Code. The extension is a thin client for the daemon and follows the same menubar preferences (provider order, visibility, thresholds), so it stays in sync with the dashboard. Zero telemetry. Install it from the [VS Code Marketplace](https://marketplace.visualstudio.com/items?itemName=onllm-dev.onwatch) (`code --install-extension onllm-dev.onwatch`), grab the `.vsix` from any release, or build it from [extensions/vscode](extensions/vscode). Full setup, settings and troubleshooting live in [docs/VSCODE_EXTENSION.md](docs/VSCODE_EXTENSION.md). **Email notifications (Beta)** -- Configure SMTP to receive alerts when quotas cross warning or critical thresholds, or when quotas reset. Per-quota threshold overrides for fine-grained control. Alerts fire once per quota cycle by default, or repeat on a configurable cooldown while a quota stays over threshold. SMTP passwords are encrypted at rest with AES-GCM. **Push notifications (Beta)** -- Receive browser push notifications when quotas cross thresholds. onWatch is a PWA (Progressive Web App) - install it from your browser for a native app experience. Uses Web Push protocol (VAPID) with zero external dependencies. Configure delivery channels (email, push, webhook, or any combination) per your preference. **Webhook notifications (Beta)** -- POST a JSON payload to any HTTP endpoint on warning, critical, reset, auth error, and Codex quota-starter events. Works with ntfy, Gotify, and custom services, with optional bearer-token auth and custom headers. Payloads never contain credentials. See [docs/WEBHOOK_SETUP.md](docs/WEBHOOK_SETUP.md). **Dark/Light mode** -- Toggle via sun/moon icon in the header. Auto-detects system preference on first visit and persists your choice across sessions. **Password management** -- Change your password from the dashboard. The hash is stored in SQLite and persists across restarts (takes precedence over `.env`). To force-reset, delete the row from the `users` table. **Single binary** -- No runtime dependencies. All templates and static assets embedded via `embed.FS`. SQLite via pure Go driver (no CGO). --- ## Who Is onWatch For?
Frequently Asked Questions
What is onWatch?
onWatch is a Software Packages library for the Go programming language. Monitor AI API quotas across providers locally with historical tracking, alerts, and a web dashboard to avoid surprise throttling and budget overruns
How do I install onWatch?
Install onWatch with the Go module system using `go get onllm-dev/onWatch`. Check the repository for the current installation instructions.
What category does onWatch belong to?
onWatch is listed under Software Packages, specifically Other Software.